When describing noise levels we use units of decibels, but what exactly are these units and how are they used?
The concept of decibels is not simple and can take a little wrapping your head around. The decibel scale is a logarithmic scale, which essentially means it compresses a very large range of values into a much smaller range in order to make dealing with these numbers more convenient. This logarithmic conversion is used is because of the enormous ratio of sound levels the human ear can deal with. Humans can detect air pressure fluctuations as small as 20 micro Pascals (0.00002 Pascals) and can cope with pressures as high as 63 Pascals before the sound becomes unbearably loud. There are approximately 6 orders of magnitude between these two numbers and it would be much more convenient to express the level as the order of magnitude itself. And that’s more or less what the decibel scale does using the following equation to calculate the sound pressure level (SPL) in decibels:
where:
p = rms acoustic pressure in Pa
pref = reference pressure of 20 µPa
p = rms acoustic pressure in Pa
pref = reference pressure of 20 µPa
Note that the logarithm is taken of the square of the two pressure values. The square of the acoustic pressure is proportional to the power of the sound wave. When we input an acoustic pressure of 0.00002 Pascals into this equation, we get a sound pressure level of 0 dB (commonly called the threshold of hearing). A pressure of 63 Pascals gives a level of 130 dB, which is commonly known as the threshold of pain.
You will notice that the right hand side of the equation above starts with a multiplier of 10. If we removed this multiplier, we would have a scale of bels instead of decibels. Our range of hearing in bels is 0 to 13. This scale is too coarse for use in acoustics and the finer decibel scale has become the standard. The decibel scale is also convenient since a change in sound level of 1 dB happens to be about the smallest change detectable by humans under lab conditions.
So now that we have this convenient range of human hearing of 0 to 130 dB, how exactly do we use decibels to assess sound levels? Firstly we need to understand the scale a little better. Changing the acoustic pressures into logarithmic decibels gives some curious results. A common mistake some people make is to assume that a level of 0 dB means there is no sound. This is not correct – 0 dB is the quietest sound detectable by a human. No sound at all would in fact correspond to a decibel level of minus infinity. Another feature of the scale is that simple mathematical functions cannot be performed conventionally. For example, decibels are not additive in the normal way. Two sources creating the same sound level combine to increase the overall sound level by 3 dB. This means that, for example, that 63 dB is twice as loud as 60 dB, 66 dB is four times as loud, 69 dB is eight times as loud and so on.
Secondly, in order to assess the sound levels experienced by humans we have to throw in an added complication. This is that humans have different sensitivities to different frequencies of sound. Healthy young people can hear frequencies as low as 20 cycles per second, or Hertz (Hz) all the way up to about 20,000 Hz (or 20 kHz). However, we have relatively low sensitivity to the very low and high frequencies in this range (especially below 200 Hz and above 10 kHz). We are most sensitive to frequencies in the range of 1 to 4 kHz.
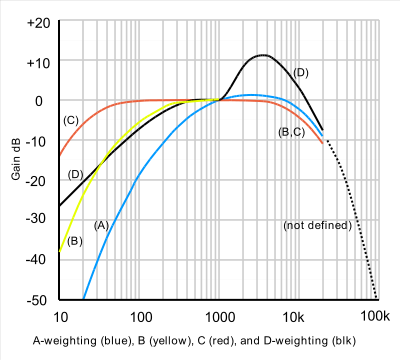
To account for this effect (and thereby more accurately represent the sound level experienced by humans) a frequency weighting is applied to the levels. This process is called A-weighting and decreases the relative contribution of the low and high frequency sounds to the overall sound level. When A-weighted decibels are expressed as values, they are given the unit dBA. When dealing with environmental noise we almost always express sound levels in dBA and not dB. The following figure shows a graphical representation of the A-weighting over the audible frequency range as well as additional frequency weightings discussed below.
To account for this effect (and thereby more accurately represent the sound level experienced by humans) a frequency weighting is applied to the levels. This process is called A-weighting and decreases the relative contribution of the low and high frequency sounds to the overall sound level. When A-weighted decibels are expressed as values, they are given the unit dBA. When dealing with environmental noise we almost always express sound levels in dBA and not dB. The following figure shows a graphical representation of the A-weighting over the audible frequency range as well as additional frequency weightings discussed below.

The shape of the A-weighting graph is in fact only accurate for very low sound levels. The sensitivity curve actually flattens out as the level of the sound increases. Additional frequency weightings B, C and D describe the sensitivity of the ear as higher sound levels, although B- and D- weightings are no longer used. Use of the C-weighting is not common unless dealing with low-frequency noise issues (it has been determined that the A-weighting is often not suitable for assessing low frequencies) or when dealing with very high noise levels.
This change in sensitivity is generally ignored in the field of environmental acoustics and, as already mentioned, sound levels are expressed as A-weighted decibels.
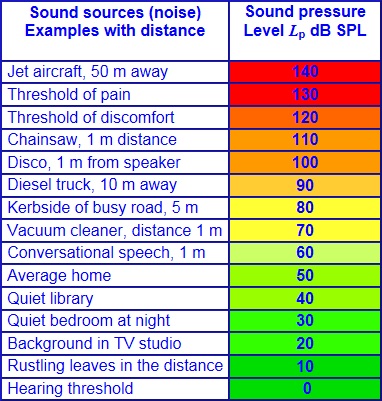
The following diagram shows some levels of common sound sources
This change in sensitivity is generally ignored in the field of environmental acoustics and, as already mentioned, sound levels are expressed as A-weighted decibels.
The following diagram shows some levels of common sound sources

